
Table of Contents
AC Charging Power Curve: Why Actual Charging Power Is Often Lower Than Rated Power
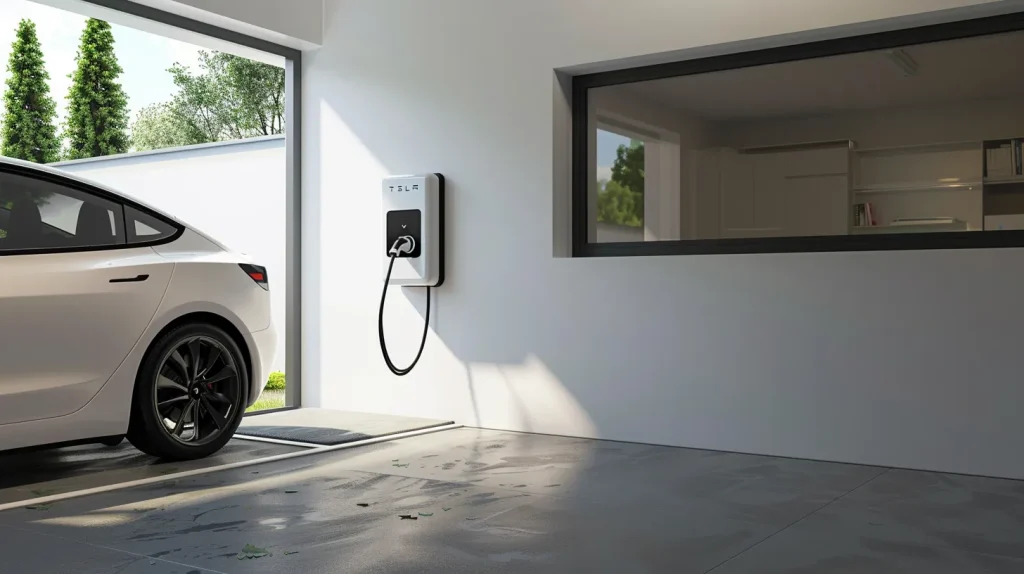
Many EV users expect that a 7 kW or 22 kW AC charger will always deliver its full rated power. However, in real-world charging scenarios, the actual charging power is often lower than the rated power.
This difference is caused by several factors including vehicle onboard chargers, battery management systems, grid limitations, and temperature conditions.
Understanding the AC charging power curve helps businesses, fleet operators, and EV owners better estimate charging time and optimize charging infrastructure deployment.
Rated Power vs Actual Charging Power
The rated power of an EV charger represents the maximum output capacity under ideal conditions. However, the vehicle itself ultimately determines how much power it can accept.
EV charging overview:
https://en.wikipedia.org/wiki/Charging_station
For AC charging, the power delivered depends on the vehicle’s onboard charger, which converts AC electricity into DC power used by the battery.
Onboard charger explanation:
https://en.wikipedia.org/wiki/On-board_charger
If the vehicle’s onboard charger supports only 7.4 kW, it cannot utilize a 22 kW AC charger fully.
Typical AC Charging Power Curve
Unlike a constant power supply, EV charging generally follows a power curve that changes during the charging process.
Battery charging behavior:
https://en.wikipedia.org/wiki/Lithium-ion_battery
Typical AC charging stages include:
- Initial ramp-up phase – charging power gradually increases.
- Stable charging phase – charging reaches near maximum power.
- Tapering phase – power gradually decreases as the battery approaches full charge.
This charging curve is designed to protect the battery and maintain long-term battery health.
Common Reasons Why Actual Charging Power Is Lower
1. Vehicle Onboard Charger Limitations
The vehicle’s onboard charger is often the primary limiting factor.
| Charger Rated Power | Vehicle Onboard Charger | Actual Charging Power |
| 22 kW | 11 kW | 11 kW |
| 11 kW | 7.4 kW | 7.4 kW |
| 7 kW | 6.6 kW | 6.6 kW |
Many EVs sold globally support 7 kW or 11 kW AC charging, even if the charging station supports higher output.
2. Battery State of Charge (SOC)
Charging power also depends on the battery state of charge (SOC).
State of charge explanation:
https://en.wikipedia.org/wiki/State_of_charge
As the battery approaches full capacity (typically above 80%), the charging power is reduced to prevent overheating and extend battery life.
| Battery Level | Charging Power Behavior |
| 0–20% | Power ramps up |
| 20–70% | Near maximum charging power |
| 70–90% | Gradual power reduction |
| 90–100% | Slow tapering phase |
This behavior explains why charging slows down significantly near the end of the session.
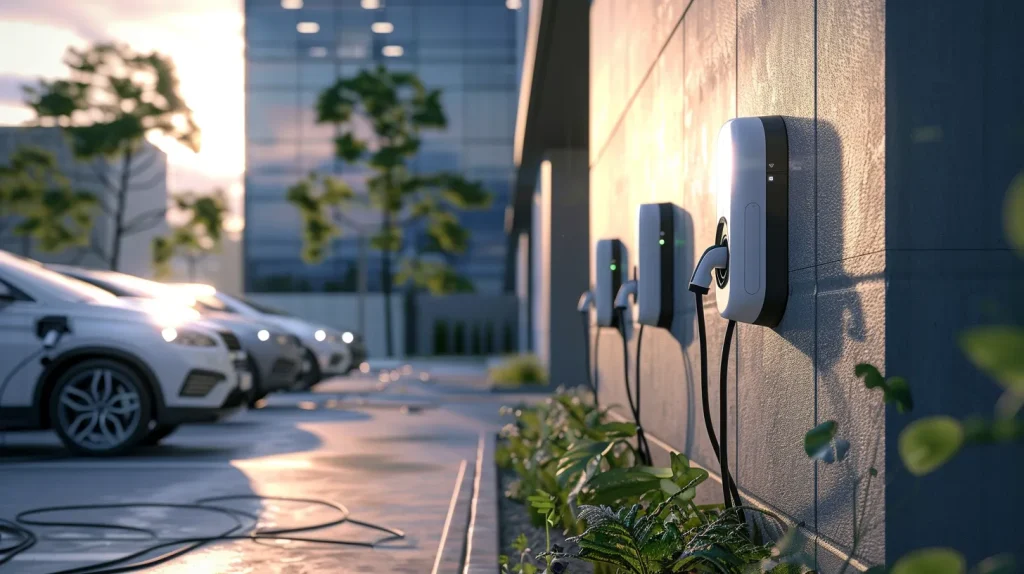
3. Electrical Infrastructure Limits
Commercial buildings or parking facilities may limit charging power due to grid capacity constraints.
Electric power distribution overview:
https://en.wikipedia.org/wiki/Electric_power_distribution
If multiple chargers operate simultaneously, systems may apply load management to distribute available power across vehicles.
Load management overview:
https://en.wikipedia.org/wiki/Load_management
For example:
| Number of Vehicles Charging | Available Site Power | Power per Charger |
| 4 vehicles | 44 kW | 11 kW |
| 8 vehicles | 44 kW | 5.5 kW |
| 12 vehicles | 44 kW | ~3.6 kW |
This ensures stable operation without overloading the electrical system.
4. Temperature and Battery Protection
Battery temperature also affects charging performance.
Battery management systems regulate charging speed to prevent thermal stress and battery degradation.
Battery management system overview:
https://en.wikipedia.org/wiki/Battery_management_system
In very cold or very hot environments, charging power may be reduced until the battery reaches a safe operating temperature.
Why Understanding the Charging Curve Matters
For businesses deploying EV charging infrastructure, understanding charging curves helps improve system design.
Key benefits include:
- more accurate charging time estimates
- better charger capacity planning
- optimized load management strategies
- improved user experience
Fleet operators and commercial charging providers especially benefit from predictable charging behavior.
The Role of Smart AC Charging
Modern charging infrastructure increasingly uses smart charging technology to optimize power distribution.
Smart charging overview:
https://en.wikipedia.org/wiki/Smart_charging
Smart charging systems can:
- dynamically allocate power between chargers
- prevent grid overload
- prioritize vehicles that need faster charging
- optimize energy consumption
This makes AC charging networks more efficient and scalable.
About QIAO
QIAO provides reliable AC EV charging solutions designed for residential, commercial, and fleet deployments worldwide.
Our charging systems support:
- smart load management
- scalable AC charging networks
- OCPP-compatible connectivity
- intelligent energy optimization
QIAO helps businesses deploy efficient and future-ready EV charging infrastructure.
FAQ
Why doesn’t my EV charge at the charger’s rated power?
Because the vehicle’s onboard charger may limit how much power it can accept.
Does charging speed decrease near full battery?
Yes. Charging slows down near 80–100% to protect battery health.
Can multiple EVs reduce charging speed?
Yes. Load balancing systems may distribute power between vehicles.
Is AC charging slower than DC charging?
Yes. AC charging relies on the vehicle’s onboard charger, which typically supports lower power levels.