
EV charging efficiency tells you how much of the electricity used for charging ends up stored in your battery. Your home meter may record more energy than your car reports, but that gap alone does not show how much your charger wastes. The readings may cover different parts of the charging process.
This guide focuses on home AC charging and explains where charging energy goes, how to compare your readings, and what losses mean for your electricity bill. You’ll also learn what to check before changing your charging settings or deciding that your equipment has a fault.
What Is EV Charging Efficiency?
EV charging efficiency is the share of input energy that becomes stored energy in your battery, expressed as a percentage. Charging power, measured in kilowatts (kW), describes how quickly energy is delivered. Kilowatt-hours (kWh) measure an amount of energy.
To interpret an efficiency figure, check which part of the process it describes. Home AC charging equipment, known as electric vehicle supply equipment (EVSE), supplies and controls power. Your car’s onboard charger (OBC) converts alternating current (AC) into direct current (DC) for the battery.
An efficiency figure measured between a charger’s input and output covers the charging equipment. An OBC conversion-efficiency figure covers AC-to-DC conversion inside the car. Neither alone tells you how much electricity ends up stored in the battery. Neither describes the full path from the electrical supply to stored battery energy. Overall efficiency includes that path, so it also accounts for the vehicle’s energy use during charging.
DC fast charging moves AC-to-DC conversion to the charging station; it does not remove that step. Compare AC and DC figures only when they cover the same energy path. Actual charging is never completely loss-free, so overall efficiency stays below 100%.
How Much Energy Is Lost During EV Charging?
EV charging losses vary with the vehicle, charging power, and battery temperature. A test result is more useful when you know the conditions behind it.
What Real-World Tests Show
ADAC’s 2026 study of EV charging losses found lower losses at an 11 kW wallbox than at a household socket across five tested cars.
| Charging Setup | Test Power Setting | Measured Energy Loss |
| European household socket | Nominally about 2.3 kW; actual power varied by vehicle | 12.7%–24.2% |
| Wallbox | 11 kW | 5.1%–7.0% |
| Reduced-power wallbox, simulating solar charging | About 4.1 kW | 8.0%–12.8% |
Measurements took place within a 10%–90% state-of-charge range, with battery temperatures of 20°C–30°C at the start. The solar setting used three-phase charging, and actual power depended on the car. These European socket results do not represent North American 120-volt Level 1 charging.
Is Charging Efficiency Below 90% Normal?
Efficiency below 90% can occur without a charger fault. In ADAC’s household-socket tests, all five cars lost more than 10% of the input energy.
A single session below 90% does not, by itself, establish that your equipment is faulty.
Where Does the Charging Energy Go?
Charging energy goes into battery storage, heat, and the systems that control charging. Some of the incoming electricity becomes heat or powers charging-related systems instead of increasing the energy stored in the battery.
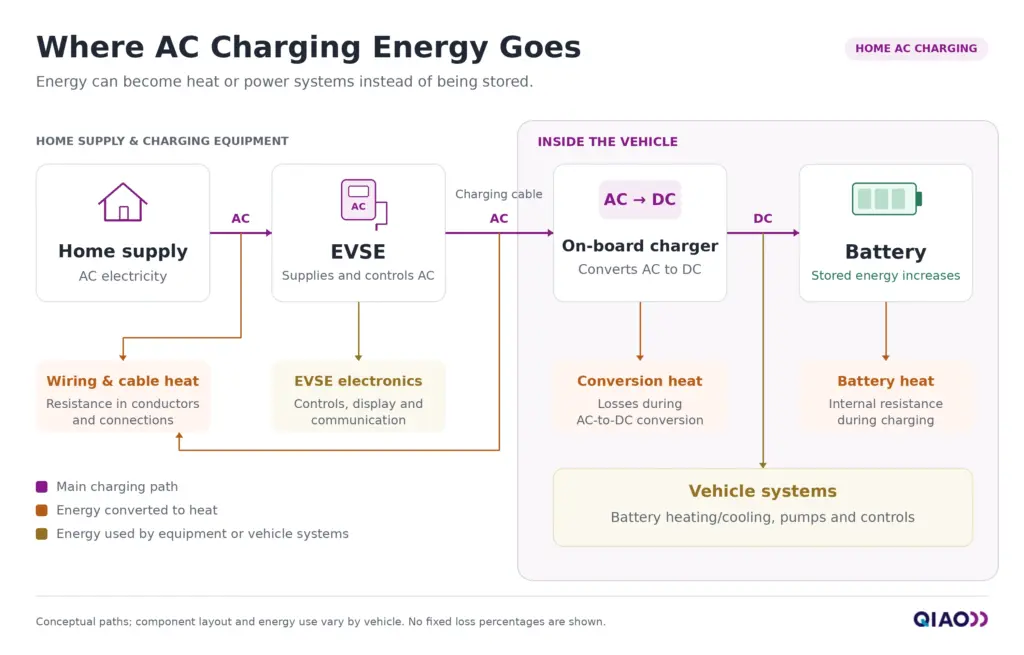
Original schematic by QIAO Charger, based on Figure 1 in Brincourt et al.’s study of AC charging efficiency (EDF R&D, EVS38, 2025).
Wiring, Cables and EV Charger
Electrical resistance in the supply wiring, charging cable, and connectors converts some energy into heat. The amount depends on the current and resistance along that path.
With the same conductor material and thickness, a longer cable has more resistance. Cable length and conductor size therefore need to be considered together. The EV charger also uses electricity for controls, displays, and communications, depending on the model.
The Vehicle’s Onboard Charger
The OBC’s power electronics produce heat during conversion. How much energy they lose depends on the design and charging power, so a fixed conversion-loss percentage cannot describe every car or setting. These losses occur inside the vehicle, even when the external charging equipment uses little energy itself.
Battery Conditioning and Auxiliary Systems
Battery heating or cooling, pumps, and vehicle control systems use part of the incoming electricity. That energy supports charging but does not increase the amount stored for driving. The battery also generates heat as current flows through its cells.
The battery management system monitors charging and may balance cells. Do not assume that the BMS uses the same share of charging energy in every EV.
Keep session losses separate from electricity used after charging ends. Charger standby power and parked-vehicle drain affect total consumption, but they should be tracked separately from the losses within a charging session.
Is Faster AC Charging More Efficient?
Higher AC charging power often reduces losses from long charging sessions, but the most efficient setting depends on your car and electrical supply.
Why Very Low Charging Power Can Increase Relative Losses
Delivering the same amount of battery energy at very low power takes longer. Vehicle systems stay active for more time, increasing their energy use per kWh stored. This helps explain why lowering the current does not always save electricity.
EDF R&D’s 2025 study of low-power AC charging tested three EVs and found that the effect of low-current charging varied by model.
Level 1 vs Level 2: What Changes in North America?
In North America, Level 1 charging uses a 120-volt supply, while home Level 2 typically uses 240 volts. Level 2 generally delivers more power, allowing the car to charge faster.
For the same amount of energy stored in the battery, a shorter session can reduce the electricity used by vehicle systems that remain active during charging. ENERGY STAR notes that Level 2 charging is generally more efficient than Level 1.
The size of that efficiency difference depends on the vehicle, actual charging power, and battery temperature. Neither charging level guarantees a fixed efficiency percentage.
Why the Best Setting Depends on the Car and Installation
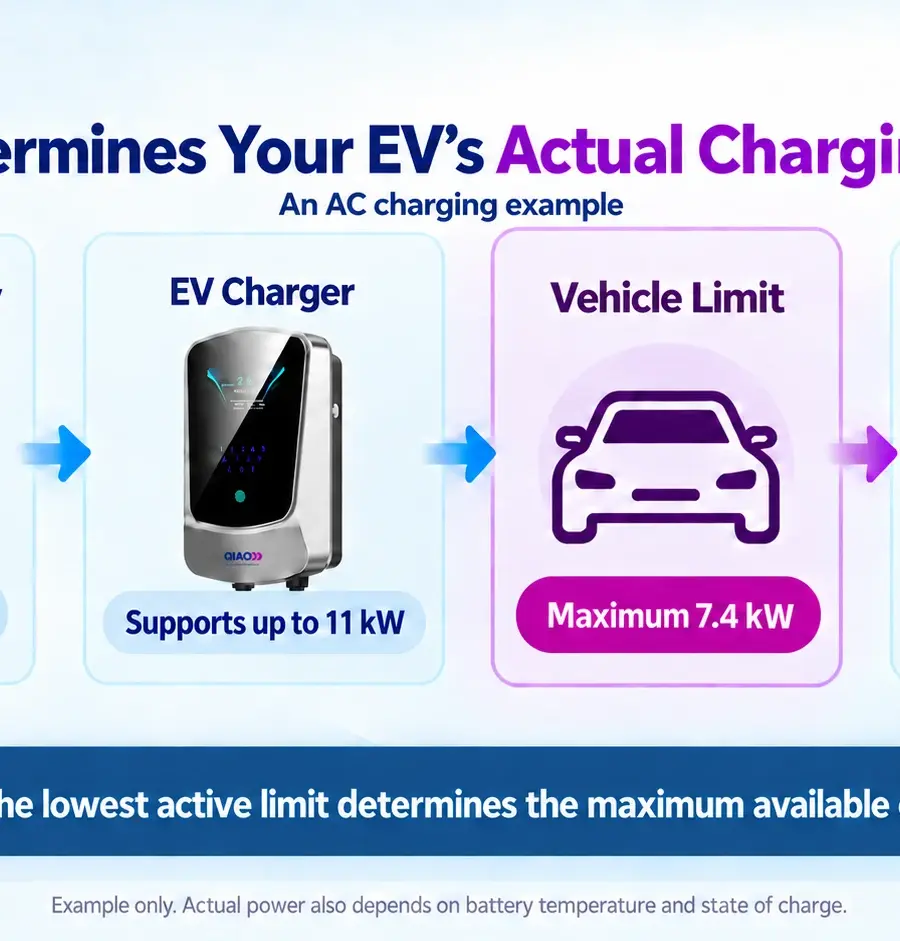
A 22 kW charging unit cannot make an 11 kW onboard charger accept 22 kW. Your vehicle and electrical supply can both limit actual AC charging power.
Whether a charger is portable or wall-mounted does not, by itself, determine overall charging efficiency.
Choose a current within the limits approved for your vehicle, equipment, and circuit. Reducing it may help manage household demand, even when it increases losses as a share of the electricity used.
How to Measure and Calculate EV Charging Efficiency
Calculate EV charging efficiency by dividing the increase in stored battery energy by the input energy from the same charging session. Use kWh for both figures and confirm what each reading measures.
Compare Measurements from the Same Session
Start with an EV-only circuit meter or your charger’s session record. Match its start and end times with the battery data. A whole-home meter includes appliances and other loads, so its total cannot directly represent the electricity used for EV charging.
Check the measurement point before using any figure:
| Reading | What It Covers | What to Check |
| EV circuit meter | Energy drawn by the charging circuit | Meter location, session times, and any standby use included |
| Charger session kWh | Energy recorded at the charger’s meter | Whether it measures input or output and which losses it includes |
| Vehicle energy report | Energy reported by the car | Whether it represents OBC output, battery input, or stored energy |
| Battery percentage change | Change in displayed state of charge | Requires usable battery capacity to estimate an energy increase |
Check your vehicle’s documentation before treating its energy report as stored battery energy. Energy entering the battery and energy retained for later use are different measurements.
Use the session’s total energy, rather than an instantaneous power reading in kW.
Use the Efficiency and Loss Formulas
Once the readings cover the same session and the part of the charging process you want to measure, use these formulas:
Efficiency (%) = Stored Energy Increase ÷ Input Energy × 100
Charging Loss (kWh) = Input Energy − Stored Energy Increase
Loss (%) = Charging Loss ÷ Input Energy × 100
For an illustrative session, suppose the input is 20 kWh and stored battery energy increases by 18 kWh. Efficiency is 90%. The 2 kWh of losses account for 10% of the input.
The input is also 11.1% higher than the energy stored, because 2 ÷ 18 × 100 = 11.1%. The percentages differ because they use different denominators.
Log Comparable Sessions and Treat SOC as an Estimate
Record several sessions for the same car using a simple charging log:
| Record | Details to Include |
| Vehicle and timing | Model, date, start time, and end time |
| Input energy | Session kWh and meter location |
| Battery data | Starting and ending SOC, plus the source of any energy figure |
| Charging power | Actual power or power range, current, number of phases, and any changes caused by load management or solar availability |
| Conditions | Temperature and any battery or cabin heating or cooling |
SOC means state of charge. Multiplying its change by usable battery capacity gives an estimate of the stored-energy increase. Capacity assumptions, rounded percentage readings, temperature, and battery ageing can affect that estimate.
Use the log to compare sessions under similar conditions. If reliable stored-energy data is unavailable, label your efficiency result as an estimate.
How Much Do Charging Losses Cost?
Charging losses cost the lost energy in kWh multiplied by your electricity price per kWh. Use the rate that applies when you charge.
For the previous example, assume a flat rate of €0.25/kWh. The 20 kWh input costs €5, including €0.50 for the 2 kWh of losses. These figures illustrate the calculation; the rate is not a market average.
To estimate the input needed for a battery-energy target, divide the required stored energy by efficiency expressed as a decimal.
If the electricity you use for charging each year is 2,000 kWh at 90% overall efficiency, losses account for 200 kWh. At the same assumed rate, that costs €50.
Track standby consumption and parking or service fees separately. Also check the basis of any published consumption figure. The US EPA’s MPGe figures already include AC charging losses, so adding the same losses again would overestimate electricity costs.
Why Does Charging Efficiency Change Between Sessions?
Charging efficiency changes when battery temperature, actual charging power, or vehicle energy use changes.
Temperature, Charging Power and Battery State
Two sessions at the same current setting may differ if the battery starts at different temperatures. Charging after a cold night and charging after a drive do not necessarily create the same conditions. Extreme temperatures affect EV charging partly by changing the need for battery heating or cooling.
Starting and ending SOC matter too. Near full charge, some vehicles reduce power or balance cells. That can change the energy used relative to the amount stored. Follow your model’s charging recommendations rather than applying one SOC limit to every EV.
Check the Readings Before Suspecting a Fault
Work through these checks when a charging-efficiency result looks unusually low:
- Check the Readings and Timing: Verify the battery-energy source, any usable-capacity assumption, and the session’s start and end times. Exclude standby consumption and unrelated household loads.
- Check Additional Vehicle Use: Review any cabin preheating, air conditioning, or battery conditioning during the recorded period.
- Check the Conditions: Compare actual power, temperature, and SOC range with the sessions or test results you are using as a reference.
- Check for a Pattern: Review several comparable sessions under normal operating conditions. A repeated change deserves closer investigation than one unusual reading.
Do not continue test sessions if you notice abnormal heating, warnings, or repeated interruptions. Follow the manufacturer’s instructions and contact your installer or service provider.
How to Reduce Charging Losses at Home
To reduce charging losses at home, choose a suitable charging power, use properly installed equipment, and limit avoidable energy use while plugged in.
Match Charging Power and Equipment to Your Home
If your session records show greater losses at very low charging power, consider a higher setting within your installation’s approved limits.
Have an installer confirm the circuit capacity and select suitable wiring. Choose a charging cable rated for the required current and long enough to reach comfortably. Follow the manufacturer’s instructions for adapters and extension cables.
Limit Avoidable Vehicle Energy Use
Turn off cabin heating or cooling during charging when you do not need it. Leave automatic battery protection systems operating as the manufacturer intends.
For cold-weather departures, the US Department of Energy recommends preconditioning while plugged in. This can preserve battery energy for your drive, but it still consumes electricity. It does not automatically improve the percentage of grid energy stored in the battery. Schedule it near departure instead of keeping the cabin warm for hours.
Manage Scheduling and Standby Use
Set charging times around your departure, electricity rates, and household demand. A cheaper charging window can reduce your bill without changing energy efficiency. Dynamic load balancing adjusts charging power to available household capacity; it does not guarantee lower losses.
Check the charger’s published standby consumption and available energy-saving settings. ENERGY STAR’s EV charger criteria include limits for power use when charging is inactive. Follow manufacturer guidance on leaving equipment connected, especially when scheduled functions or updates depend on it.
Is Low-Power Solar Charging Still Worth It?
Yes. Low-power solar charging can still make financial sense if using surplus solar costs less than buying grid electricity, after allowing for charging losses. A lower charging efficiency does not automatically mean a higher bill.
Compare the cost of storing the same number of kWh in your battery. Include any grid electricity added during charging and the export payment you give up by using solar at home. If surplus generation would otherwise earn little or nothing, using it for charging may be worthwhile despite greater losses.
Your departure time matters too. Check whether the available solar can deliver enough energy before you leave. Confirm the minimum charging power your vehicle supports and how the car and controller handle changes in solar output or pauses.
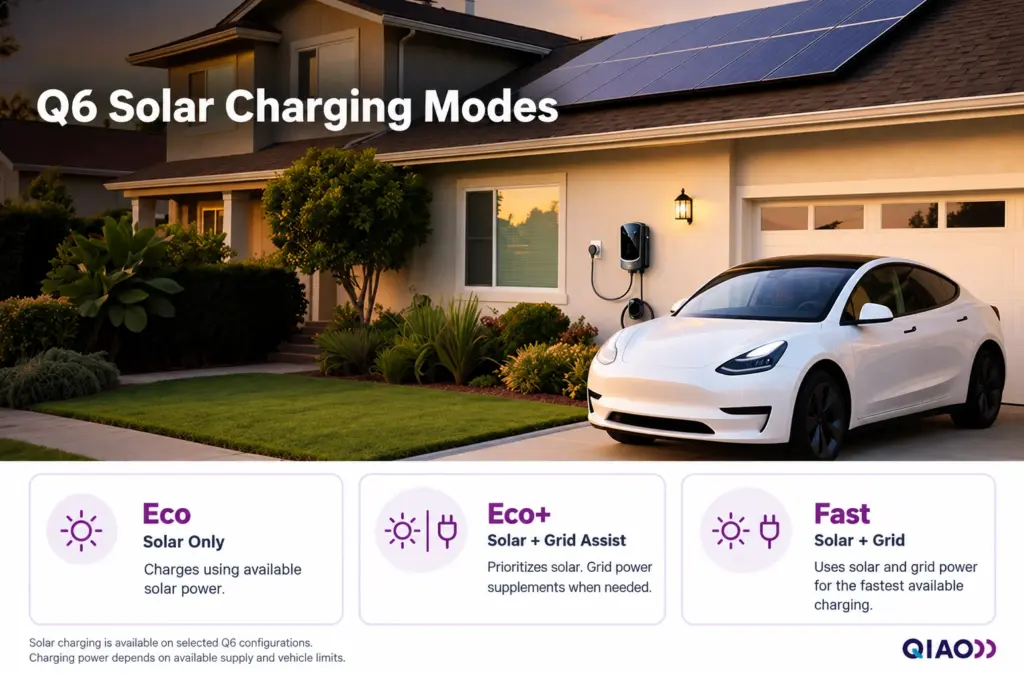
Selected solar-capable configurations of the QIAO Q6 Home EV Charger offer Eco, Eco+, and Fast charging modes, as shown below.
With dynamic load balancing (DLB), charging current decreases when other household electricity use rises. As household demand falls, it can increase again within the configured supply limit.
Q6 offers wired and wireless LoRa DLB options, both using CT clamps to monitor household current. If you need DLB, solar charging, or both, confirm the appropriate Q6 configuration and required monitoring equipment with your installer.
Conclusion
Compare charging sessions using the same measurement points and similar conditions. If a result changes, check the readings and vehicle energy use before changing your setup. Then weigh charging losses alongside electricity prices, solar availability, and departure time. Choose settings that meet your daily charging needs at a reasonable cost.
About QIAO Charger
QIAO Charger offers home EV chargers, portable EV chargers, and charging cables and accessories for home and travel use. Choose equipment that matches your vehicle’s connector, AC charging limit, and electrical supply. Available features vary by model and configuration.
We also work with distributors, retailers, and other channel partners building an AC EV charging product range. Explore our partnership opportunities to discuss product selection, documentation, and supply for your market.